Growth and Concentration Trends in the French-language Media Economy in Canada, 2000-2014
Introduction
This is the fourth and final installment of a four-part series on the state of the telecoms-internet and media industries in Canada (see here, here and here for the previous reports). Its focus is on the development of eleven sectors of the network media economy in French-language regions of Canada from 2000 until 2014: mobile wireless; wireline telecoms; internet access; cable, satellite and IPTV; broadcast television; pay and specialty television services; total television (combining broadcast and pay and specialty services); radio; newspapers; magazines; and online advertising.
The report charts the development of the main sectors of the telecoms-internet and media industries over the last decade-and-a-half within Quebec. It also asks whether these industries have become more or less concentrated over time, and answers the question using two widely used methods for judging such matters: concentration ratios (CR4) and the Herfindahl-Hirschmann Index (HHI).
Finally, the focus on Quebec is designed to draw out the distinctive conditions of the telecoms-internet and media industries in the province – conditions that can be obscured by the national level of analysis found in the first two reports in this series. The report prior to this one did the same for the mainly English-speaking regions of the country. The comparisons are instructive, as we shall see.
A PDF version of this report is available here, while the dataset underpinning the analysis is available here for download and use under Creative Commons terms. Additional resources for further analysis of the media in French-language regions of Canada can be found in a recent study put out by the GRICIS research project at Université du Québec in Montreal and the Centre d’études sur les médias at Laval.
So what did we find?
The Growth of the French-Language Network Media Economy, 2000-2014
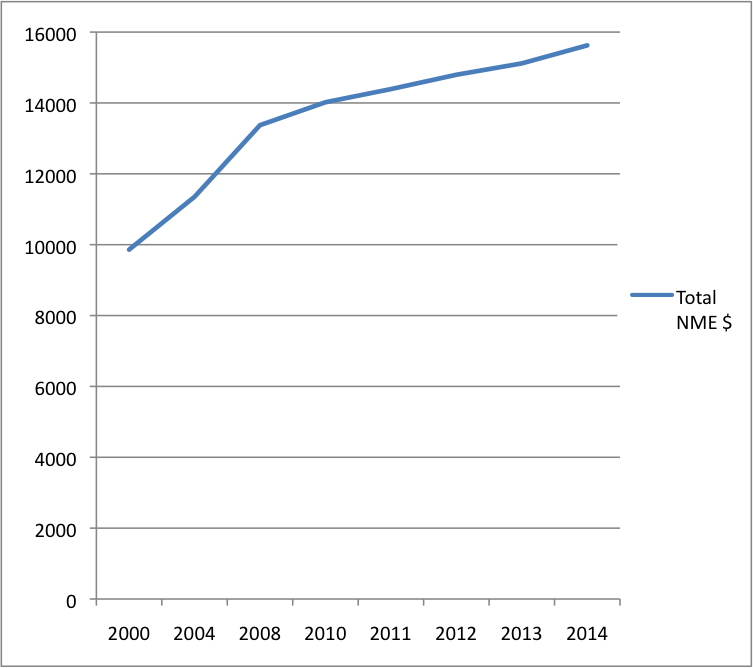
The media economy in the mainly French-language speaking regions of Canada expanded tremendously over the past decade-and-a-half, as has been the case in other parts of the country. Indeed, total revenues rose from $9.9 billion in 2000 to $15.6 billion last year. Overall, however, the media economy in Quebec is still relatively small, accounting for around a fifth (20.7%) of the Canadian total when the province’s population makes up just under a quarter of the national total.
Figure 1 below shows the growth of the French-Language network media economy over time.
Figure 1: The Growth of the French-Language Network Media Economy, 2000-2014 (Millions $)
Sources: see the “French Network Media Economy” sheet in the French Media Market Excel Workbook.
The French- and English-language media markets have grown at roughly the same pace after 2000, i.e. about 3% per annum, but with some interesting differences between them. Anglo-speaking regions grew faster earlier, for instance, but were then hit harder by the ‘great financial crisis’ of 2008 and unsteady economic situation ever since. The pace of growth has since plunged from 5 percent per year to just less than 2 percent.
In Quebec, in contrast, a more leisurely rate of growth of 4 percent per year proceeded apace for much of the first decade of the 21st Century but since 2008 that pace has been clipped to just under three percent. Moreover, unlike in the English-speaking regions of Canada where growth fell flat in 2014, in Quebec the pace of growth slowed, but still grew all the same. These differences likely reflect the fact that the fastest growing parts of the media economy – mobile wireless, internet access, internet advertising, cable television – took off later in Quebec, and thus were still picking up steam before being knocked back by economic instability.
As elsewhere across Canada, distinct growth trajectories can also be seen for different segments of the network media economy in Quebec. Four key points stand out in this regard:
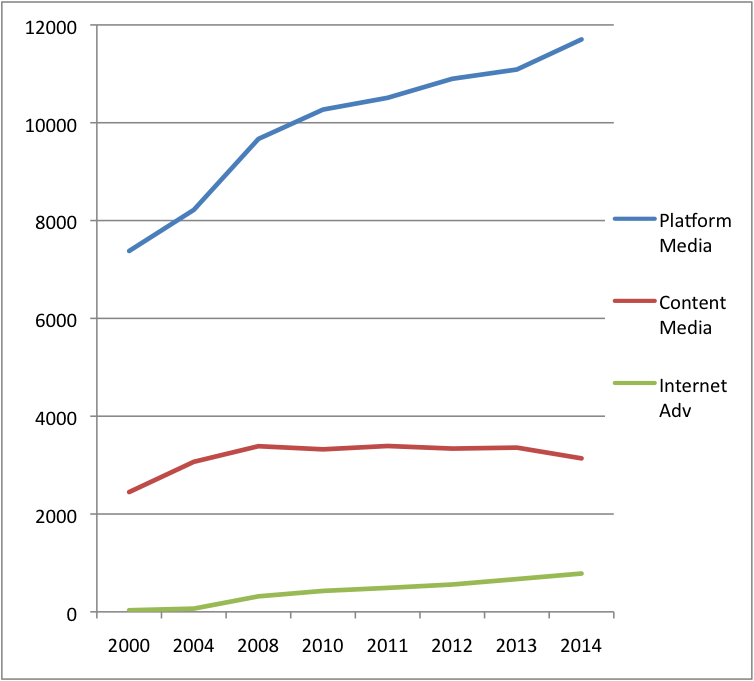
- the platform media (mobile wireless, plain old telephone service, internet access) and internet advertising, on the one side, have grown far faster than the content media (television, radio, newspapers and magazines, on the other), on the other; the platform media industries are much larger than the content media, accounting for three-quarters of all revenues in 2014.
- total revenue for the content media industries flat-lined from 2008 to 2013, before plunging nearly 7 percent in 2014; the share of the content media has declined from a quarter of total revenues in 2000 to one-fifth in 2014;
- Carriage dominates content in an internet- and mobile-centric media world, and this dominance is becoming more pronounced over time;
- the impact of the economic downturn has hit the content-media industries much harder than the platform media industries, which continued to grow, on average, by about 3.3% per year since 2008.
Figure 2 below illustrates the points.
Figure 2: Growth and Development of Platform Media vs Content Media and Internet Advertising, 2000-2014 (Millions $)
Sources: see the “French Network Media Economy” sheet in the French Media Market Excel Workbook.
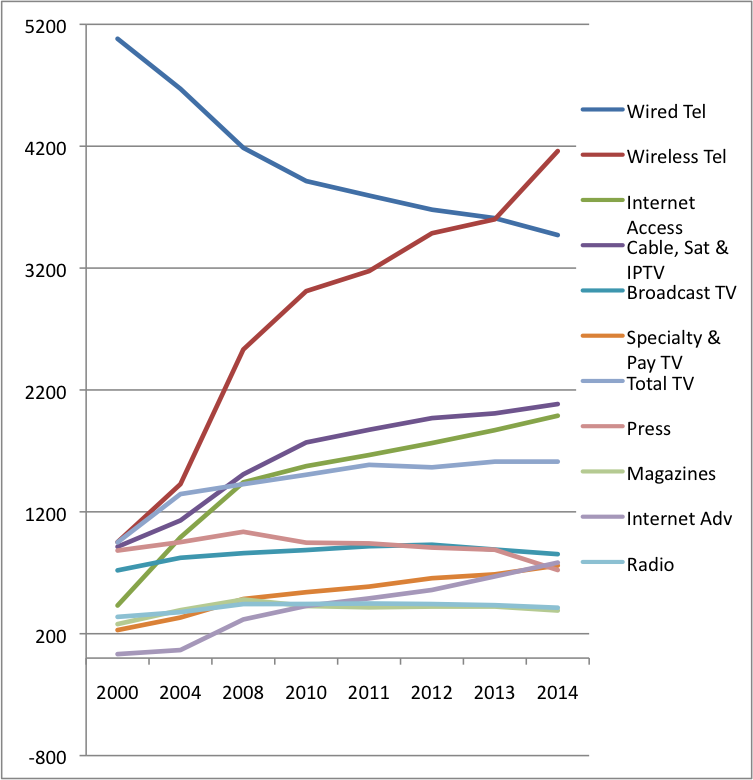
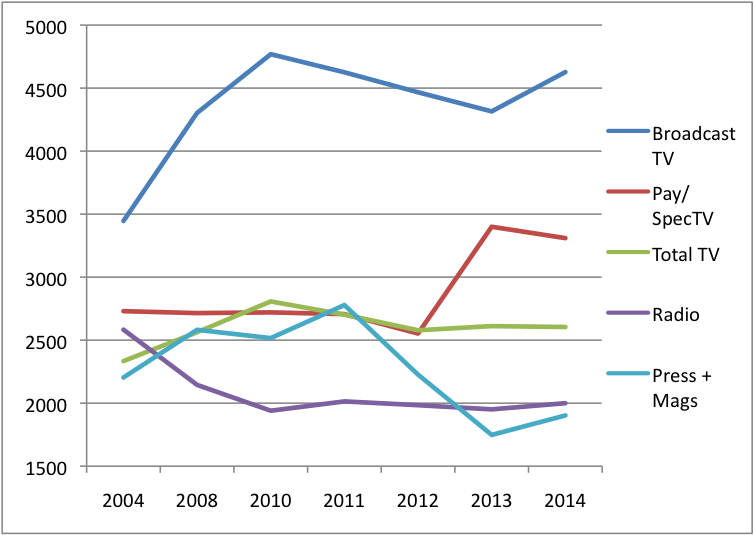
Figure 3 drills down deeper to show the distinctive development paths for each sector since the turn-of-the-21st Century. As it shows, all of the sectors covered in this report have grown considerably since 2000. The fates and fortunes of each sector, however, varies dramatically.
Figure 3: Separate Media, Distinct Evolutionary Paths in the French-language Network Media Economy, 2000–2014 (Millions $)
Sources: see the “French Network Media Economy” sheet in the French Media Market Excel Workbook.
The fastest growing sectors of the French-language media economy have been internet advertising (2,310%), internet access (361%), mobile wireless (337%), cable, satellite and IPTV (128%), specialty and pay TV (128%) and the ‘total television’ category (70%). On its own, IPTV growth has soared by more than 7000% since 2008.
In sum, the platform media industries and television are driving the growth of the network media ecology. This is as true in the French-language media ecology as it is elsewhere across the country and around the world. The media ecology is becoming far more internet- centric, mobile and personal as a result – consistent with what we have found in each of the other reports in this series.
At the opposite end of the spectrum, broadcast television has stagnated since 2008. This has occurred largely on account of weak advertising revenue but the effects have been compounded by substantial cuts of nearly $40 million – or 10% — to the budget of Radio-Canada/CBC French-language broadcast TV service since 2011 (see the ‘CBC sheet’ in the Master Workbook). Radio stands in much the same position for much the same reasons. Overall, the decline in broadcast television, however, has been offset by substantial growth in specialty and pay television services.
At the hardest hit end of the spectrum, three sectors stand out: wireline telecom, newspapers and magazines. Wireline telecoms, or plain old telephone service (POTS), has fallen by nearly a third in terms of revenue. Newspapers revenues appear to have peaked in 2008 at $1,036 million, but have since dropped thirty percent to $722.6 million. Magazines have followed much the same path, with revenue peaking at $480.5 million in 2008, then falling to $390.2 million last year – a drop of roughly a fifth in just over half-a-decade.
As newspaper, magazine and broadcast TV advertising revenue falls, internet advertising, as noted above, has surged. With estimated revenues of $379 million and $107 million, respectively, from operations in the French-language markets of Canada, Google and Facebook account for nearly two-thirds of that revenue.
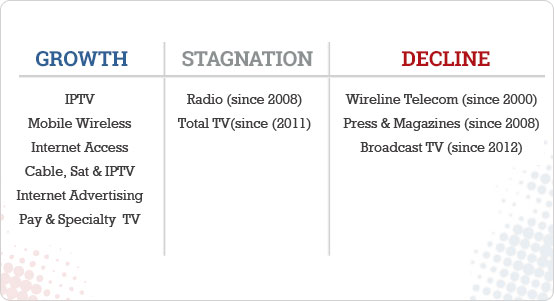
Figure 4 below gives a snapshot of the patterns of growth, stagnation and long-term decline for each of the telecoms-internet and media sectors covered in this report.
Figure 4: Growth, Stagnation and Decline in the French-language Media Economy, 2014.
The Platform Media Industries: The Triumph of Carriage Over Content?
The ‘platform media’ industries have grown enormously. In 2000, total revenues for these sectors in the mainly French-language speaking media economy were $7.4 billion. By 2014, their combined value had risen to $11.7 billion.
Fundamentally new sectors have been added (IPTV), emergent ones have surged (internet access) and others have grown steadily (BDUs), although some elements within this last domain have begun to recede in recent years (cable and satellite).
Table 1 below tracks the development of these sectors from 2000 until last year.
Table 1: Revenues for the Platform Media Industries, 2000-2014 (Millions$)
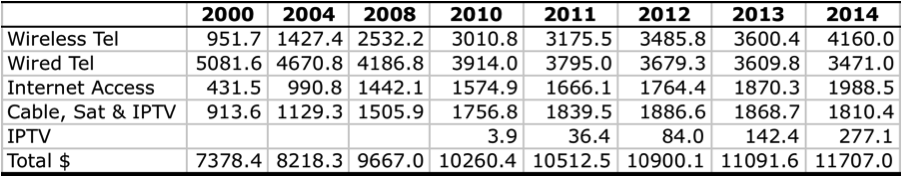
Sources: see the “French Network Media Economy” + “IPTV” sheets in the French Media Market Excel Workbook.
The Mobile Wireless Market in Quebec: Significant Changes But Not a Revolution[1]
The mobile wireless (cellphone) sector in Quebec has been one of the fastest growing sectors of the network media industries, again as has been true in the rest of Canada. It is now the largest sector by far with revenues of $4.16 billion in 2014, more than four times the level they were in 2000. Nonetheless, wireless subscription rates in Quebec lag far behind the rest of Canada. In fact, only 69% of Quebecers have a wireless subscription versus a national average of 80%, the lowest level in the country other than the North (see CRTC, CMR, Table 5.5.14).
In contrast to the fast rising fortunes of the mobile wireless sector, wireline telecoms services continued their long-term decline in 2014. Revenue last year was $3.5 billion, far off the high-water mark of $5.1 billion at the turn-of-the-21st century. Yet, as elsewhere, and as we shall see below, such declines have been more than offset by strong growth in internet access, IPTV and cable revenues.
The POTS market is the most concentrated of all sectors in Quebec, and has been perennially so. Bell is the dominant player by far with nearly ¾ of the market share, trailed far behind by Quebecor at just under 14%. Last year, the top four firms – Bell, Quebecor, Telus and Cogeco – accounted for 96.2% of the market share by revenue. The HHI was sky high at 5738.
While such high levels of concentration might be glossed over by the suggestion that this is a dying industry, one also sees extremely high levels of concentration in two of the fastest growing sectors, namely mobile wireless and internet access.
While growing fast, the mobile wireless market, for instance, is also the second most concentrated of all the markets examined in this report. The top three firms – Bell (33.8%), Rogers (29.7%) and Telus (29.7%) – accounted for 93.1% of the market by revenue in 2014. However, one very significant trend moving gradually in the opposing direction is the rise of Videotron as a formidable rival to the “Big 3” since entering the market after acquiring spectrum in the last two major rounds of spectrum auctions in 2008 (AWS) and 2014 (700 MHz), respectively.
Quebecor’s share of the market in 2014 was 6.9% (based on revenues), double what it was four years earlier. Since entering the fray, Videotron has effectively demonstrated the viability of the 4th player strategy pursued by the previous government since 2008.
Compared to a decade ago, the change has been significant. The big three have each seen their share of the market eroded, especially Bell, whose market share has fallen from 50% in 2004 to 34% last year. Collectively, their market share has fallen to 93% based on revenue from 100% a decade ago, or 88% on the basis of subscribers (see Table 2 below).
Table 2: Wireless Market Share (by Subscriber) by Provider and Province, 2014
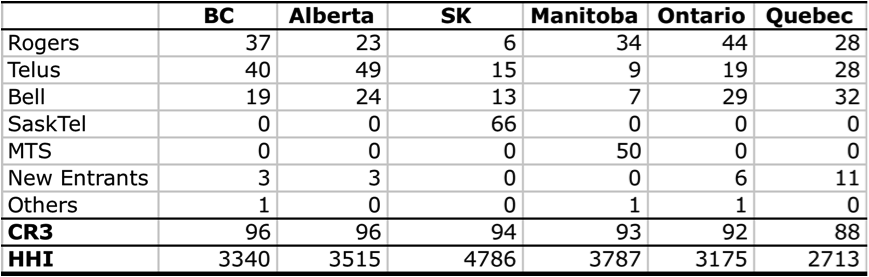
Source: CRTC, unpublished. Record on file with author.
Despite the downward drift in concentration levels it is a far cry from saying that the situation in Quebec is one where a competitive marketplace prevails. Indeed, the wireless market is still very highly concentrated regardless of whether one measures on the basis of subscribers or revenue.
On the basis of the subscribers, as Table 2 illustrates, concentration remains high with a CR3 of 88%. The HHI is firmly in the very highly concentrated zone at 2713 (recall that the threshold for this designation is 2,500). Using revenue as our measure, the point is stronger yet, with a CR3 of 93% and an HHI of 2947 (see the “Wireless” sheet in the French Language Media Market Workbook). That said, however, Quebec still stands out as (a) the province with the lowest levels of concentration, which, in turn, is (b) an indicator of the viability of a “4th mobile wireless carrier” strategy.
That the market remains highly concentrated can be seen in how Videotron’s behaviour conforms closely to that of the incumbents in at least four ways. First, Videotron and Rogers have a joint network sharing agreement similar to the ones that exist between Bell and Telus nationwide and between them and SaskTel in Saskatchewan, and between Rogers and MTS in Manitoba – a tight-knit web of arrangements that have not been extended to those outside the incumbent cable and telephone company “club”.
Second, Videotron is sitting on valuable spectrum (the public airwaves) acquired at steeply discounted prices in the AWS and 700 MHz auctions that it has yet to deploy and which it recently forthrightly indicated it is unlikely to deploy outside of Quebec. Like the network sharing arrangements just mentioned, this highlights the persistent regional nature of telecommunications in Canada, and the difficulty of fostering a strong and independent fourth national wireless carrier.
The carriers who own existing networks are the ones that are best placed to survive as they build out their wireless networks in ways that allow them to exploit the economies of scope associated with large network systems. As the adage goes, wireless companies’ first imperative is to get signals out of the air and into the ground as fast as humanly possible, that is, onto the wireline infrastructure built up over the past half-century in the case of the cable companies and for more than a century by the telephone companies.
Third, much like the ‘Big 3”, Videotron has staunchly opposed the introduction of more competitors through Mobile Virtual Network Operators (MVNOs). This is especially problematic in a province that has the next to lowest subscriber rates in the country, given the role that MVNOs play in bringing new subscribers into the market with attractive pricing plans and other inducements not usually offered by the leading players. Such a stance is also unlike other 4th wireless operators in the United States and United Kingdom, such as T-Mobile and Three, respectively, both of which Videotron otherwise seems to model itself on.
Fourth, Videotron has adopted many of the same problematic business strategies of those it seeks to challenge, notably by zero-rating services – an arrangement where services selected by a carrier do not count against subscribers’ data caps while all others obtained over the ‘open internet’ do. Indeed, Videotron has been at the fore in pressing the case for zero-rating services, having already lost in just one such instance earlier this year (e.g. the CRTC’s Mobile TV decision decided against it (and Bell)), while currently teeing up yet another now before the CRTC in relation to its “Unlimited Music” service (see here), which is basically a play on T-Mobile’s “Music Freedom” offerings in the United States (see here, here, here, here and here on these services specifically and on the issue of zero-rating in general).
In sum, while the 4th wireless carrier policy has certainly delivered benefits in Quebec, and there is no doubt that the big three have lost market share, the evidence up until now suggests that such a move certainly does not constitute a revolution, given that the viable players in the province – as in the rest of Canada – are typically themselves incumbent telecommunications firms. In this regard, economies of scope and scale, accumulated rights of way, long-standing market dominance, and the companies’ tendency to fly like a flock in a market best described as a tight oligopoly, are all reminders that telecommunications markets are unlikely to ever be fully competitive. Given this, there is a persistent need for regulators and policy-makers to keep a strong hand on the tiller.
Internet Access: Growing Fast But More Concentrated Than Ever
Internet access is the second fastest growing segment of the network media economy in Quebec after internet advertising. Internet access revenue soared more than four-and-a-half fold between 2000 and 2014, from $431.5 million to just under $2 billion ($1988.5 million).
Concentration levels have soared in the province as well. In 2000, the top four companies accounted for 43.5% of internet access revenue and the HHI was comfortably in the highly competitive zone at 833. Fast-forward to 2014 and the same top four ISPs took in 85.4% of all revenue, and the HHI of 3057 was at the very opposite end of the spectrum relative to where it was a decade-and-a-half earlier. The top two firms accounted for more than three quarters of the market: Videotron (43.7%) and Bell (33.3%). Cogeco (5.4%) and Telus (3%) trailed far behind.
In Quebec, the levels of concentration in the internet access market are higher than anywhere else in the country by a wide margin. Table 3 below illustrates the point.
Table 3: Internet Concentration in Quebec vs the “Rest of Canada”, 2014 (based on market share by revenue)
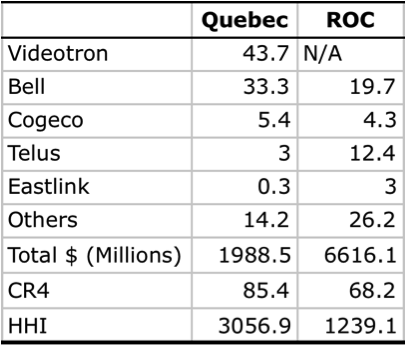
Sources: see the “ISP” sheets in the French and English Media Market Excel Workbooks.
It is worth recalling that it is just such realities that underpinned the CRTC’s wholesale wireline decision earlier this year that found that indy ISPs still need regulated wholesale access to the incumbents’ local Fibre-to-the-Premise (FTTP) networks if they are not to die as internet access shifts from copper and coaxial cables to fibre to the doorstep. As the Commission’s decision documented with respect to Canada in general:
- “incumbent carriers continu[e] to dominate the retail Internet access services market” (para 125);
- “there is limited rivalrous behaviour to constrain upstream market power” (para 122);
- wireless Internet access is not an acceptable substitute for wireline facilities (para 126);
- whatever “competition that does exist today is . . . a result of regulatory intervention” (para 126).
Given the very high concentration levels in Quebec relative to the rest of Canada, these points apply with particular force in the province. They are another reason why the new Government should reject Bell’s Petition to Cabinet to over-turn the CRTC’s mandated wholesale access ruling. They are also very good reason to reject similar pleadings that try to deny such realities in order to keep regulators and policy-makers, as well as people, politics and the public(s)’ voices, away.
The Evolving TV Delivery System: Cable, Satellite and IPTV (or Broadcast Distribution Undertakings (BDUs)) in Quebec
The broadcast distribution market (BDUs) – or TV delivery system in colloquial terms – in Quebec has thrived since the turn-of-the-21st century, with revenue soaring from $913.6 million in 2000 to $2.1 billion last year. As with its brethren in the rest of Canada, cable TV is not in crisis. The two biggest traditional cable companies in Quebec – Videotron and Cogeco – are coming under strong and mounting pressure but this is not so much from cord-cutting as it is from new rivals, especially Bell and, less so, Telus, wielding an important new technology: Internet Protocol TV (IPTV) and fibre-to-the-doorstep (or neighbourhood).
Table 4 below depicts the growth of the TV delivery business and for each of its constitutive parts, (i.e. the BDU sector, as the sector is called in Canadian regulatory parlance.
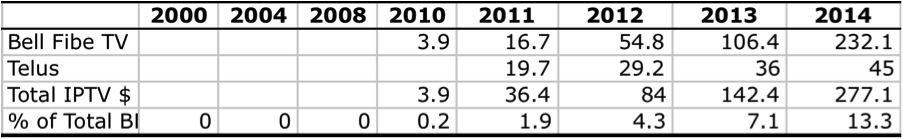
Table 4: Cable, Satellite and IPTV Growth, 2000–2014 (Millions $)
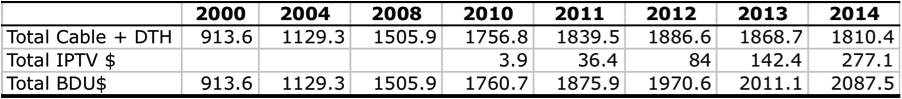
Source: see the “CableSatIPTV” and “IPTV” data sheets in the Excel Workbook.
As Table 4 shows, the TV delivery business is not in crisis, although there is a major transformation of the cable television industry underway with the advent of IPTV. This has no doubt inflicted much considerable pain on the traditional cable companies in Quebec. Videotron’s cable television revenues have been basically flat-lining for the past three- to four years, while those of Cogeco have plunged by 17%
The biggest source of these two companies’ woes is not so-called cable cutting but the fact that the total number of subscribers to IPTV services in Quebec has exploded from under 10,000 in 2010 to around 315,000 last year. The growth in revenue has matched the pace, reaching an estimated $277.1 million in 2014, up from just $4 million five years earlier.
Bell and Telus’s IPTV services accounted for an estimated 13.3% of the TV delivery business’ revenue in Quebec. Roughly one-in-seven people in the province get their television service from their local telephone company – an impressive number relative to five years ago but less than in English-language speaking regions of the country where the figure was closer to one-in-five.
Tables 5 and 6 below show the trends.
Table 5: Growth of IPTV Subscribers in Quebec, 2000–2014 (year-over-year average)

Source: see the “IPTV” data sheet in the French Media Market Excel Workbook.
Table 6: Growth of IPTV Revenues in Quebec, 2000–2014
Source: see the “IPTV” data sheet in the French Media Market Excel Workbook.
There is no doubt that Bell’s rapidly rising share of the market and Quebecor’s similarly rapid decline in market share lends itself to both companies’ sense of urgency. The two companies have increasingly clashed over the past decade-and-a-half. BCE’s market share has nearly quadrupled, rising from 10% in 2000 to 37% last year, while Videotron’s has slid from 72% in 2000 to 52%.
Nonetheless, the TV delivery business is still very highly concentrated in Quebec.
It is much more concentrated than in the rest of Canada. In 2014, the CR4 was 98% and the HHI a sky-high 4132. Moreover, concentration has hardly budged during recent years. In the early 2000s, the HHI fell from 5418 to the low 4000-range by decade’s end, where it has stayed ever since.
In general, the TV delivery business in Quebec, like most places in Canada, is a duopoly. Two companies dominate in Quebec with a combined market share of 89%: Quebecor (51.8%) and Bell (37.1%). The top two firms in the rest of the country — Shaw (30.6%) and Rogers (24.5%) – account for considerably less: 56%. There are three other main companies in Quebec: e.g. Cogeco, Telus and Eastlink. They lag far behind Quebecor and Bell, with 8.6%, 2.8% and well-under 1% market share, respectively.
Figure 5 below illustrates the point.
Figure 5: Cable, DTH & IPTV French-Language Market Share, 2014
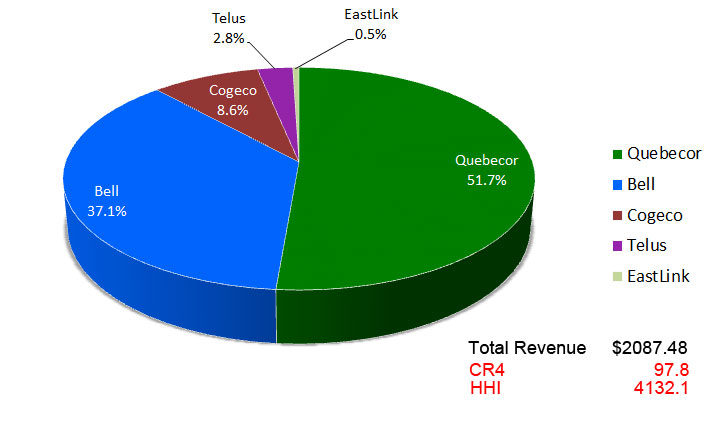
Source: see the “CableSatIPTV” data sheet in the French Media Markets Excel Workbook.
Figures 6 and 7, below, depicts the trends with respect to concentration levels over time for each of the platform media industries within the French-language media economy based on Concentration Ratios (CR4) and the Herfindhahl – Hirschman Index (HHI), respectively.
Figure 6: CR4 Scores for the Platform Media Industries in the French-language Media Economy, 2000-2014
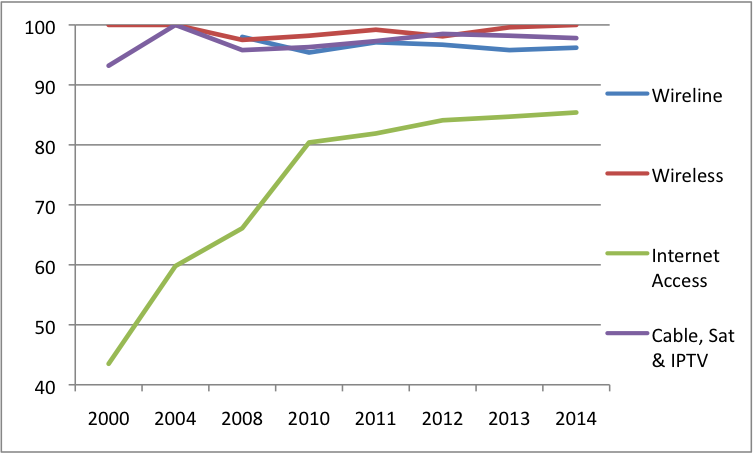
Source: see the “Top 10 Ranking” and “English CR & HHI” data sheets in English Media Market Excel Workbook.
Figure 7: HHI Scores for the Platform Media Industries in the French-language Media Economy, 2000-2014
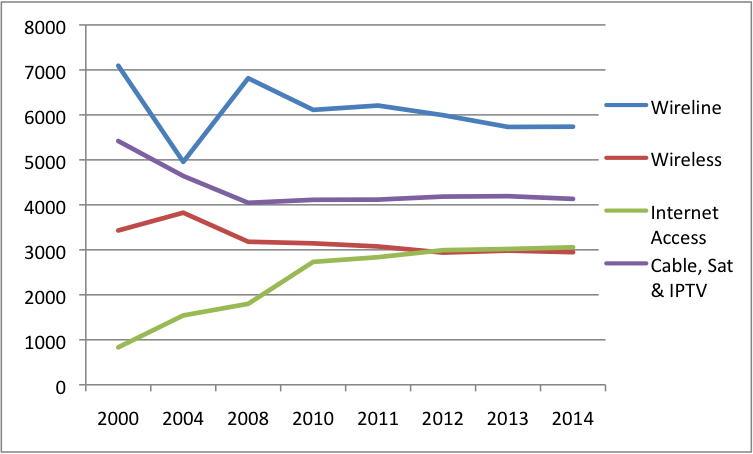
Source: see the “Top 10 Ranking” and “English CR & HHI” data sheets in English Media Market Excel Workbook.
As Figure 6 shows, all of the French-language platform media industries are at the very top of the scale for concentration when measured by the CR4 standard. Changes that have occurred have been in a very narrow band, except in the case of internet access, where concentration levels have doubled since the turn-of-the-century.
The HHI measure in Figure 7 provides a more sensitive view the changes that have taken place over time. While there has been a modest decline with respect to mobile wireless, wireline and TV Delivery, all of the sectors remain very firmly within the “highly concentrated” range. The sharp increase in concentration with respect to internet access also stands out. In general, concentration levels are much higher in Quebec and have proven more intractable, with the exception of mobile wireless, at least to a degree.
Horizontal Integration and Control of the Pipes and the People’s Spectrum
So far we have seen that the platform media industries – mobile wireless, POTS, internet access and the TV Delivery business – have grown greatly, with total revenues across these sectors surging from $7.4 billion in 2000 to $19.9 billion last year. Massive new sectors have developed from next-to-nothing (e.g. mobile wireless and internet access), others have grown significantly (e.g. TV Delivery) while others have gone into decline (POTS), although even here such networks are currently being refurbished to bring fibre networks closer to the doorsteps, desktops and devices of the nation.
We have also seen that each of these industries is also very highly concentrated. The following paragraphs and Figure 8 below also show that levels of ‘horizontal integration across these industries is also very high.
Figure 8 begins to illustrate the point by presenting the market share for each of the main communications companies across the communications landscape as a whole, i.e. mobile wireless, POTS, internet access and TV delivery (aka BDUs).
Figure 8: Horizontal Integration and Carrier Control in Quebec, 2014
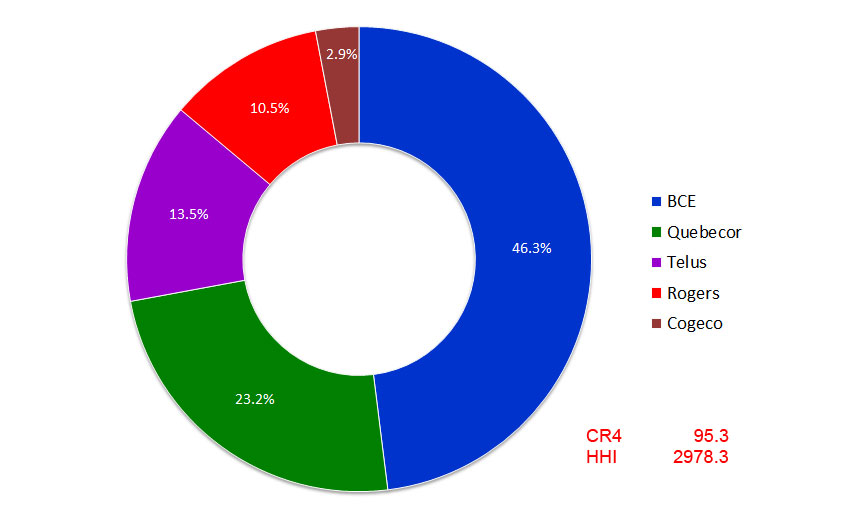
Source: see the “Pipes” data sheet in the French Media Markets Excel Workbook.
Looking across the “carrier industries”, Bell stands out as the biggest player by far. It single-handedly accounts for 46.3% of all revenue from these industries. Quebecor accounts for 23.2%.
Between the two, they control 70% of revenue across the communications sectors. Bring in Telus (13.5%) and Rogers (10.5%), and the number rises to 93.5%. The HHI is 2978 is also at the very high end of the spectrum.
Vertical Integration: Are Communications Companies Carriers or Editors?
In addition to concentration being high within specific sectors, and horizontally across the platform media industries, vertical integration between carriers and content providers is extraordinarily high in Quebec. Bell and Quebecor are once again the two biggest vertically-integrated companies in the province. Between the two, they account for 59% of all revenues across the entire media landscape. Cogeco is also vertically-integrated, but its footprint in the province is tiny by comparison. Bring it into the mix, and the provinces three vertically-integrated companies accounted for 62% of all revenue.
Nearly every study of media in Canada stresses the colossal role of Quebecor in Quebec, and rightly so. The company’s reach across the telecoms, internet access, TV, newspaper, magazine, book and music retailing landscape is as sprawling as it is encompassing. With revenue of $3.3 billion in 2014, it took in 21% of all French-language media revenue last year. The political ambitions of its controlling and historically interventionist owner, Pierre Karl Péladeau – and now head of the Party Québécois – have stoked concerns that Quebecor’s massive media might is being used for political clout and personal gain (see here and here).
To be sure, Quebecor does cut an imposing figure in Quebec. However, Bell is bigger, and in fact by a very wide margin.
Bell’s revenues of $5.9 billion last year outstripped Quebecor’s $3.3 billion by a considerable amount. BCE single-handedly accounted for 38% of all revenue across the telecoms-internet and media landscape in Quebec, roughly equal to the next three players combined: Quebecor (21%), Telus (10%) and Rogers (8%).
Figure 9 below helps to depict the scale and scope of the various players in the French-language media.
Figure 9: Leading Telecoms-Internet and Media Companies in Quebec, 2014
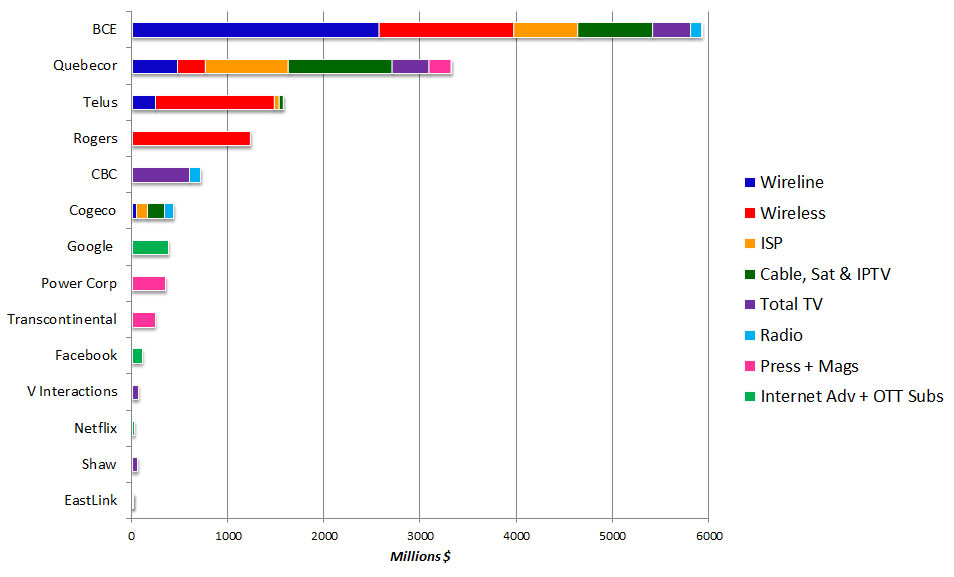
Source: see the “Top 10 Ranking” sheet in the French Media Markets Excel Workbook.
As Figure 9 demonstrates, Bell and Quebecor are in a league of their own in terms of their sheer size and the scope of their operations. Cogeco is also a vertically-integrated company on account of its stakes in internet access, POTS, TV Delivery and radio, but it is puny by the standards of Bell or Quebecor.
After Cogeco, another half-dozen or so second tier players fill the ranks. These companies’ operations tend to be focused on just a few segments of the content media: CBC, Google, Power Corp., Transcontinental, Facebook, V Interations, Netflix, Shaw Corus and Eastlink. None of them has a significant role as a carrier in the province. They are mostly editors not carriers.
The vertically-integrated carriers also dominate the TV landscape in Quebec as well, although the CBC-Radio Canada continues to cut a significant figure on the landscape. Figure 10 below illustrates the point.
Figure 10: Vertically-Integrated BDUs and the Total Television Market in Quebec by Market Share (based on revenue), 2014
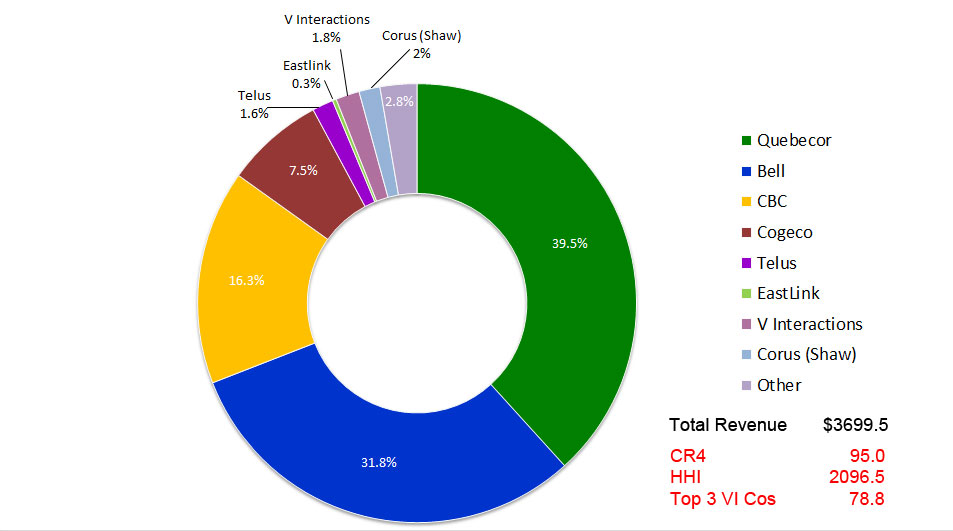
Source: see the “Top 10 Ranking” sheet in the French Media Markets Excel Workbook.
Bell and Quebecor account for 70% of the total TV universe, a measure that includes both TV Delivery and TV Programming services, as Figure 8 shows. Add the next two biggest firms, and the CR4 reached a lofty 95% in 2014; the HHI score of 2906 registers a highly concentrated set of markets. The figures are also very high relative to the rest of Canada (see Figure 14 in last section of this report)
The Content Media Industries in Quebec
Long Live Television
The television landscape is a three-legged stool in Quebec, as it is elsewhere, consisting of: broadcast TV, specialty and pay services delivered by BDUs, and the emergent OTT sector exemplified by Netflix and Videotron’s illico TV. Overall TV revenue in the French-speaking areas of Canada rose rapidly from $1,155.6 million to an all-time high of $1,612 million from 2004 to 2014, although revenue has been basically flat since 2012.
Unlike in the rest of Canada, broadcast TV is still the largest segment of the TV landscape in Quebec and significantly larger than pay and specialty TV services. Broadcast TV revenue grew slowly during the first decade of the new century but then seems to have peaked at $930.2 million (including the CBC-Radio Canada’s Parliamentary funding) in 2012, and to have declined since. By 2014, broadcast TV revenue had fallen to $852.8 million.
The decline is due to a drop in advertising revenue and cuts to the CBC-Radio Canada. Indeed, the cuts of $40 million to the CBC-Radio Canada budget since 2011 have been substantial, accounting for roughly 10% of its budget (see the ‘CBC sheet’ in the Master Workbook).
Specialty and pay TV services in Quebec have grown briskly, in contrast, albeit not as fast as elsewhere in Canada. Specialty and pay TV service revenue were $759.2 million in 2014, more than twice what it had been a decade ago ($352.7 million). And unlike broadcast TV, these services continue to grow at a swift clip even in the face of the economic hard times since 2008, reflecting the reality that pay-per media tend to be less susceptible to economic bad times than those that depend on advertising.
Netflix plays a smaller role in Quebec than it does in English-language parts of the country, mostly because its catalogue consists mainly of English-language titles. According to the CRTC, 12% of Francophones subscribe to Netflix versus 39% in the mainly English speaking regions of the country (CMR, Table 4.3.7). Once the estimated revenue for Netflix of $24.8 million last year is included in the mix, the size of the total TV market expanded to reach $1,636.8 million last year.
While Netflix has not taken hold as much in the province, Quebecor has been quicker off the mark than its English-language counterparts or Bell within the province, with its own OTT service, illico TV. Revenue for illico in 2014 were $56.4 milllion (see here), more than double those of Netflix and likely multiple times higher than Bell’s corresponding CraveTV.
Table 7, below, shows the development trends across all three dimensions of the “Total TV” landscape.
Table 7: Growth of Total TV Revenues, 2004-2014 (millions $)
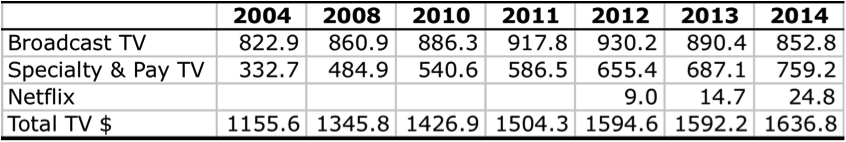
Source: see the “Broadcast TV”, “Specialty and Pay TV” and “Top 10 Ranking” data sheets in the French Market Excel Workbook.
There are three key players in French-language broadcast television: CBC/Radio Canada (62% market share), Quebecor/TVA (27%) and V Interactions (8%). The sector is extremely concentrated with the top 3 players accounting for nearly 97% of revenue. The HHI score is sky-high at 4627, and up significantly over a decade earlier. Bell has no interests in this segment.
French language specialty and pay TV services are also highly concentrated, and have been so for the past decade, albeit with a significant upturn since 2013. As a matter of fact, concentration levels had been drifting slightly downwards but this reversed course in 2013 when Bell acquired Astral Media – the largest specialty and pay TV provider in the province (and the country) at the time, with a 40% share of the market.
Bell’s share of the French-language specialty and pay TV market soared from 22% in 2012 to 53% two years later as a result. Quebecor’s market share was a distant second at 18.3%. Combined, the two behemoths controlled 71.5% of the market, trailed far behind by the CBC (9.6%) and Shaw (Corus) (7.6%). In sum, the top four companies controlled 89% of the market. Moreover, while the HHI of 2553 was already in the zone of high concentration in 2012, it jumped to 3310 by last year on account of Bell’s acquisition of Astral Media the year before.
Shaw’s (Corus) recently enlarged place in Quebec is also a noteworthy element within this reorganization of the TV ownership landscape. It has played a small role in the French-language TV market for the past decade-nad-a-half through its 50% ownership stake in the Historia and Séries+ services, with the other half of those owned by Astral. Shaw (Corus) doubled its share of the French-language specialty and pay TV services market in 2013, however, after acquiring Télétoon as well as the remaining 50% ownership stakes in Historia and Séries+ that it did not already own. It did so as part of the divestitures ordered by the Competition Bureau and CRTC in return for their blessing of Bell’s take-over of Astral. Shaw (Corus) gained some newfound prominence in the French-language TV market as a result, but the bigger effect was the elimination of the largest independent TV provider in Quebec (i.e. Astral), while driving the level of concentration in the province to new heights.
Taking a look across the ‘Total TV’ universe as a whole (but excluding Netflix), we can see that it is highly concentrated by either the CR4 (90%) or the HHI (2604). The biggest entity is still Radio Canada-CBC, with 37.3% market share, trailed by Bell (25%), Quebecor (TVA) (23.6%) and V Interactions (4.2%). In other words, the top four players accounted for 90% of total TV revenue, up from 84.4% a decade earlier.
Figures 11 and 12, below, chart the trends over time for each segment of the TV market – broadcast, specialty and pay, and total TV – while also peering ahead to show the trends with respect to radio, newspapers and magazines, the final sectors covered in this report.
Figure 11: CR Scores for Content Media in the French-language Media Economy, 2000-2014

Sources: see the “Broadcast TV”, “Specialty and Pay TV” and “CR & HHI” data sheets in the French Media Market Excel Workbook.
Figure 12: HHI Scores for Content Media in the French-language Media
Sources: see the “Broadcast TV”, “Specialty and Pay TV” and “CR & HHI” data sheets in the French Media Market Excel Workbook.
Radio: Mixed Signals
Radio continues to constitute an important medium and one that grew between 2004 and 2011, with revenues rising from $377 million to $448 million. However, conditions have flagged since, with revenue falling to $413.3 million last year.
The CBC still cuts a formidable presence in Quebec along with two other roughly equal sized players: CBC (27.1%), Bell (26.1%) and Cogeco (23.5%). Radio is not nearly as concentrated as any of the other sectors reviewed in this report, and also unlike other media, concentration has drifted downward over the past decade. The CR3 was 84.2% and the HHI 2,583 in 2004, respectively; by last year the CR3 had fallen to 77% and the HHI to 2000 – with the latter falling well into the “moderately concentrated” designation.
That downward trend had actually been quite significant up until 2011, but at that point in time two events took place to reverse the direction. The first was the station swap between Cogeco and Shaw (Corus) in 2011 that saw the latter leave the Quebec radio market in return for acquiring several Cogeco English-language stations.
The second was Bell’s acquisition of Astral Media in 2013. Bell had no presence in French-language radio prior to this transaction, but by acquiring Astral it came to be the largest French-language broadcaster in the country – bigger than the CBC. This did not affect that market concentration levels within the radio sector, however, because it simply substituted a new owner (Bell) for where the old one (Astral) used to be. However, looked at more broadly, Bell’s take-over of Astral’s former place in Quebec radio was part of a larger transaction that did move the dial on concentration levels across the media.
Newspapers and Magazines: Crisis and Concentration
The last comments for this post are for the newspaper and magazine sectors (see the “Press+Mags” sheet in the French Media Markets Workbook).
French-language newspaper and magazine revenue grew significantly in the first few years of the 21st century, up from $1161.2 million in 2000 to what appears to have been a peak of $1516.7 million in 2008. They have plunged since. Last year, revenue for French-language newspapers and magazines was $1,112.8 million, basically the same as it had been at the turn-of-the-century, and a drop of more than a quarter from its peak in 2008.
One crucial thing distinguishes French-language dailies from their English-language counterparts: pay walls. Unlike the English-language press where twenty-eight dailies accounting for half of total weekly circulation have put up pay walls to try and staunch the industry’s economic woes, only two out of ten dailies in Quebec representing a third of total weekly circulation – Quebecor’s Le Journal de Montréal and Le Journal de Québec – have done so (also see here).
Power Corporation’s La Presse has thus far resisted the temptation. Instead, it has worked hard to move existing subscribers over to a new free, app-based version of the paper, while also attracting new readers that it hasn’t otherwise been able to reach. The publishing schedule has been pared down to one-day-a-week. While the new experiment has been a success insofar that it now accounts for 30% of LaPresse’s advertising revenue, and the Toronto Star hired it to help build a replica fit for that paper, it is still too earl to tell if this approach will staunch the bad news that has been killing the press (Montreal-based journalist Steve Faguy offers good analyses of LaPresse’s newspaper app here and here).
The difference in the extent to which English- and French-language dailies have embraced pay walls is interesting in its own right, as well as worth exploring and explaining. One potential explanation is that people’s unwillingness to pay for the news reflects the fact that ‘news as a public good’ looms larger in Quebec given that Radio Canada/CBC has a far more prominent place in the province than in the rest of Canada. The resilience of Radio-Canada/CBC, as well as its early and large-scale embrace of the internet, are additional dimensions of this explanation, with the latter being a steady source of hostility among French and English media outlets alike (see here, here, here and here, for example). In addition, people in Quebeckers seem to be less willing to pay for media, as we have seen in terms of the lower uptake of specialty and pay TV, cable TV and mobile wireless in the province.
While newspaper publishers struggle to come up with new sources of revenue, the disarray in the industry can be seen in a number of other ways, including falling revenues, cuts to editorial and journalistic staff, pared back publishing schedules and a number of newspaper swaps that have taken place in the last few years. Quebecor in particular has drastically scaled back by selling 74 weekly newspapers to Transcontinental in 2013, followed a year later by the sale of its six English-language Sun newspapers, 27 small community dailies, 140 weeklies and several websites (e.g. Canoe.com and Autonet.ca) across the country (see here).
These steps have left Quebecor with a pared back presence in the press, although it’s two flagship dailies, Le Journal de Montréal and Le Journal de Québec, continue to be influential papers of record in Quebec and still account for just over 34% of the weekly total circulation. However, some of these moves have also allowed second tier players such as Transcontinental to emerge as a more significant player within the French-language newspaper market. By 2014, it had estimated newspaper revenues of $85 million and thus about an 11.6% share of the newspaper market.
As a result of these moves that have scaled back some of the biggest players while allowing others to scale up, concentration levels across the newspaper and magazine sectors have declined. While concentration levels rose until peaking at very high levels in 2011, when the CR4 stood at just under 85% and the HHI at 2779, by last year both the CR4 and HHI had come down significantly. The top four newspaper and magazine groups accounted for 76% of total revenues last year, while the HHI of 1903 meant that concentration levels had slid down into the moderately concentrated zone.
The biggest newspaper publisher in Quebec is Power Corp. Its seven daily newspapers accounted for 41% of the total weekly circulation in 2014: La Presse, Le Nouvelliste, La Tribune, La Voix de l’Est, Le Soleil, Le Quotidien, Le Droit. It’s estimated revenue in 2014 was $350.7 million, just under half of all newspaper revenues in the province. As a sign of the economic woes buffeting the press, however, revenues across Power Corp’s papers have dropped greatly in recent years, from an estimated high of $586 million in 2008 to $350.7 million last year.
Despite this drop in revenue, Power Corp’s scale can also be seen in the fact that it is the eighth largest media company in Quebec, as Figure 9 above showed. Combined with Quebecor’s Le Journal de Montréal and Le Journal de Québec, Power Corp’s flagship dailies La Presse and Le Droit are the French-language papers of record in Quebec, agenda setters in their own right, and significant engines in the news ecology of the province. Together, the two companies dominate the market with three-quarters of the total weekly French-language newspaper circulation.
The French-language newspaper market is far more concentated than the English language press, although this will change in 2015 once the effects of Postmedia’s take-over of the half-dozen Sun newspapers and many community papers takes affect. In the French-language press, however, as of 2014, the top four groups accounted for an estimated 90% of the market: Power Corp (41.1%), Quebecor (34.4%), Transcontinental (11.6%) and Le Devoir (2.7%).
Yet, the obvious question here is whether any of this even matters if newspapers are facing death’s door, and being rapidly replaced by the internet as people’s main source of news?
The short answer is yes. This is because credible scholarly research, at least in the U.S., suggests that 85%, and perhaps as much as 95%, of professionally reported news originates with the daily press (see, for example, Jones, 2009, p. 4). That figure no doubt needs to be recast in light of the realities of journalism in Canada, and notably the substantial role of the CBC/Radio-Canada in producing original news, but the point is that the press as a vitally important engine of news creation that cascades across the mediascape, as well as amongst political and business elites who still turn to authoritative sources for the news of the day.
It is just such dominance that draws a critical eye to the towering presence of, especially, Power Corp and Quebecor when it comes to the news media. At the same time, however, Bell’s relative absence from ‘opinion influencing media’ in the French language that seem to give it a freer hand in this regard while keeping it out of the critical gaze of those concerned with how control of the press opens up the potential to shape and influence public opinion on important matters of the day and perceptions of the world more generally.
And for all those who might dismiss such notions as relics of a bygone era, it might be helpful to point back to the final passages in the second report in this series in which the question of internet news loomed large. While the headline conclusion there was that Canadians get their news online from a plurality of sources, domestic and foreign, old and new, the discussion also showed that the major newspaper groups in Canada still loom large as internet news sources. And relevant to the question at hand, three of the top four French-language newspaper groups – Quebecor, Power Corp and Transcontinental – also ranked amongst the top internet news sources.
In this regard, two things stand out as being important. First, given that people increasingly get their news via the internet and mobile devices the economic woes affecting journalism ‘offline’ have a deleterious effect for the news ‘online’. Second, while the shake-out that is occurring within the press in particular has brought down levels of concentration and enlarged the role of second tier players such as Transcontinental, it is not clear that such entities have anything better to offer in terms of quality journalism and a willingness to allocate resources to do the job.
Concluding Thoughts
Studying the media industries and their evolution over time is never easy, and it becomes more difficult the deeper one probes simply because so much data is not made public. However, based on what we do know and some reasonable estimates of revenues and market shares derived from that, we can arrive at a pretty detailed and reasonable portrait of the French-language network media economy.
First of all, we can summarize the general results by sorting different sectors of the network media economy into those that rank low, moderate or high on the concentration scale according to the HHI. Figure 13 below does just that.
Figure 13: Concentration Rankings on the Basis of HHI Scores, 2014
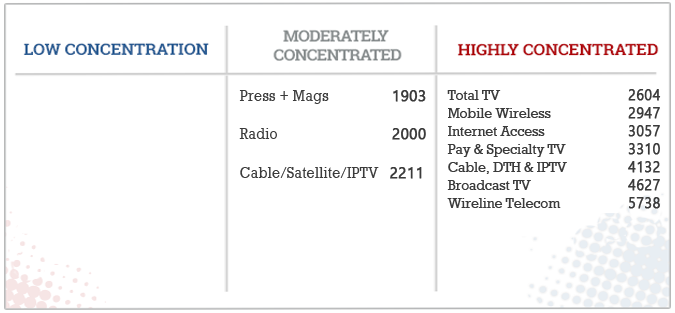
Source: see the “CR+HHI” data sheet in the French Media Market Excel Workbook
It is also instructive to compare each of the different levels of analysis that we have done over the course of this series, that is, to show the results that allow us to compare concentration levels in the French, English and Canada-wide network media economy. Figure 14 below does just this.
Figure 14: Concentration Levels in the French, English and Canadian Media Economy Compared on the Basis of HHI Scores, 2014
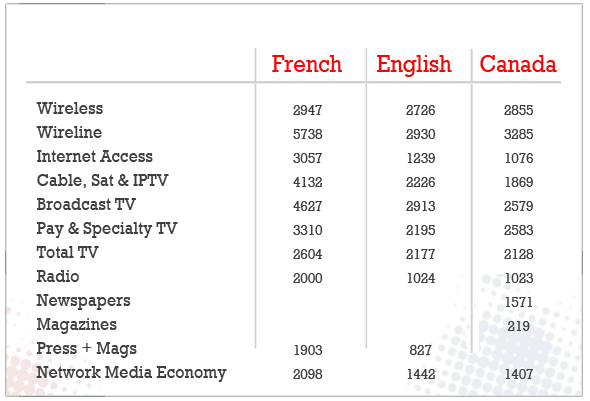
Sources: see the “CR+HHI” data sheets in the French, English and Master Excel Workbooks, respectively.
Based on the preceding discussion and analysis, and the snapshots in Figures 13 and 14 of where things stood with respect to concentration levels on the basis of HHI scores in the French-language media economy on its own and relative to the rest of the country, we can distill the key trends and developments over time. In this regard, several things stand out.
- the French-language media economy is very highly concentrated; the HHI score of 2098 for the French-language media economy as a whole greatly exceeds levels in the English-language media (HHI = 1442) and Canada as a whole (1407) (Figure 14);
- Bell is the largest player with 38% of all revenues across the media economy as a whole, followed by Quebecor with 21% across an equally large span of media, telecom and internet markets. The two are in a league of their own.
- Levels of vertical and horizontal integration are also very high relative to the rest of Canada and as pointed out in the second report in this series, the level in the latter is already very high by historical and international comparative standards, all of which helps to illustrate the extraordinary conditions in Quebec in this regard.
- To be sure, there are some reasons for cautious optimism, with some of the trends in the mobile wireless sector suggestive of that – e.g. growing subscriber levels, some increase in competition and better pricing plans – but also a series of issues that suggest that the main new rival, Videotron, will do little to smash the mold. Instead, it looks set to take its place in an industry where incumbents in the telephone and cable industry enjoy many benefits from the long established position and economies of scope and, to be sure, competing with one another along the way, but largely within a framework of an oligopolistic market.
[1] Many thanks to Ben Klass for additional and valuable insights in this section of the report.